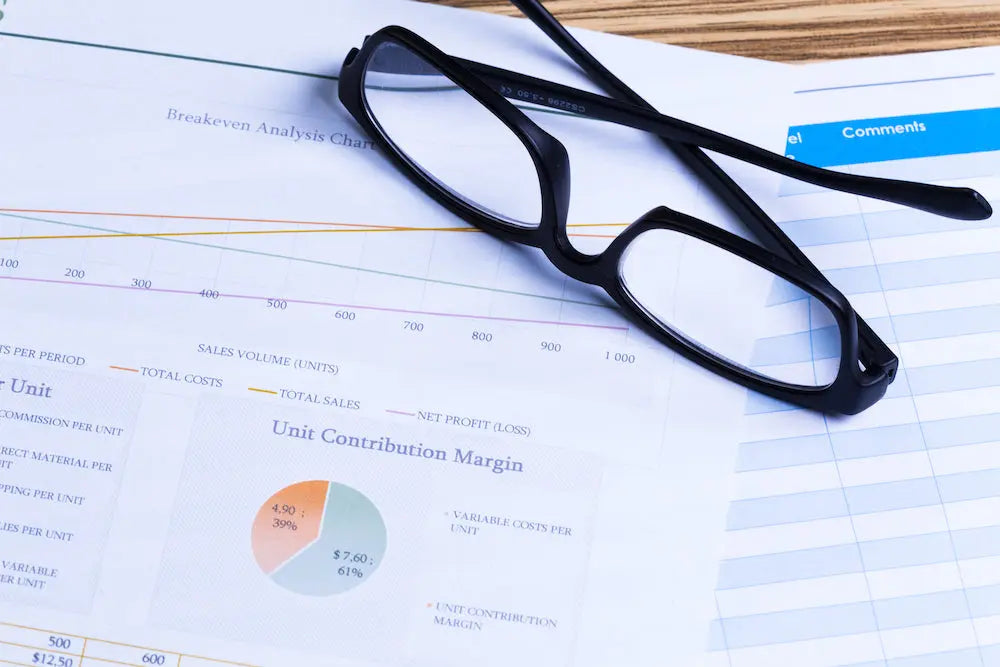
Financial analysts play a crucial role in ensuring the financial health and strategic direction of their organizations. Their responsibilities extend beyond just crunching numbers; they must ensure that financial goals are measurable, time-bound, reported accurately, attainable, and relevant. This article presents a comprehensive framework for financial analysts, detailing key strategies and tools to enhance goal management and reporting.
Define Objectives and Scope
- Identify Goals: Clearly define the purpose of the report. Is it for internal decision-making, compliance, investor relations, or performance tracking?
- Determine Scope: Specify the scope of the analysis, including the time period covered, specific financial metrics, and any limitations.
Data Collection
- Source Identification: Identify all relevant data sources, such as ERP systems, accounting software, financial databases, and market research reports.
- Data Gathering: Collect data systematically from identified sources, ensuring data accuracy and completeness.
- Data Integration: Consolidate data from multiple sources into a central repository for easy analysis. Use tools like Excel, databases, or data warehouses.
Data Cleaning and Preparation
- Data Validation: Check for data accuracy, consistency, and completeness. Correct any discrepancies or errors.
- Data Transformation: Convert data into the required format. This might include standardizing data, calculating ratios, and adjusting for currency or inflation.
Analysis and Interpretation
- Perform Analysis: Use analytical tools and techniques to interpret the data. This can include trend analysis, variance analysis, ratio analysis, and forecasting.
- Generate Insights: Identify key insights and findings from the analysis. Understand the implications of these findings for the business or project.
Reporting
- Structure the Report: Organize the report into a logical structure with sections such as Executive Summary, Detailed Analysis, Findings, and Recommendations.
- Visual Representation: Use charts, graphs, and tables to visualize data and make the report more understandable.
- Draft the Narrative: Write clear and concise text to explain the data, insights, and recommendations. Ensure that the narrative aligns with the visual data representations.
Review and Validation
- Internal Review: Conduct an internal review of the report to check for accuracy, completeness, and clarity. This might involve peer reviews or supervisor reviews.
- Stakeholder Feedback: Share the draft report with key stakeholders for feedback. Incorporate their input to refine the report.
Presentation and Distribution
- Prepare for Presentation: Develop a presentation format if the report needs to be presented. Highlight key findings and recommendations.
- Distribute the Report: Share the final report with stakeholders through appropriate channels, such as email, cloud platforms, or printed copies.
- Follow-Up: Be available to answer any questions or provide further explanations as needed.
Continuous Improvement
- Gather Feedback: After distributing the report, gather feedback on its usefulness, clarity, and comprehensiveness.
- Refine Processes: Use the feedback to improve data collection, analysis, and reporting processes for future reports.
- Stay Updated: Continuously update your skills and knowledge with the latest tools, techniques, and industry trends.
Utilizing Essential Tools
Financial Software and Tools
- Microsoft Excel and Google Sheets: For data entry, calculation, and analysis.
- Tableau and Power BI: For creating interactive dashboards and visual reports.
- QuickBooks and Xero: For generating standard financial reports.
Data Visualization Software
- Tableau: For building interactive dashboards.
- Power BI: For creating and sharing visual reports.
- QlikView: For developing guided analytics and dashboards.
Reporting Automation Tools
- SAP Crystal Reports: For creating highly formatted reports.
- Workiva: For automating financial reporting processes.
Project Management Tools
- Trello and Asana: For organizing reporting tasks and tracking progress.
- Slack: For enhancing team communication and coordination.
Industry Research and Market Analysis
- Bloomberg Terminal and Reuters Eikon: For real-time data and analytics.
- Morningstar Direct and FactSet: For investment analysis and portfolio management.
- IBISWorld and Statista: For industry-specific data and insights.
Example Framework: Monthly Financial Performance Report
Define Objectives and Scope:
- Objective: Provide an overview of the company’s financial performance for the month.
- Scope: Monthly report covering revenue, expenses, profit margins, and key financial ratios.
Data Collection:
- Sources: ERP system, QuickBooks, sales database, and market research.
- Gather Data: Extract data from the ERP system and QuickBooks for the relevant month.
Data Cleaning and Preparation:
- Validation: Check for missing or inconsistent entries.
- Transformation: Calculate monthly totals, averages, and key ratios.
Analysis and Interpretation:
- Perform Analysis: Conduct variance analysis comparing actual performance against budgeted figures.
- Generate Insights: Identify key drivers of performance, such as significant expense increases or unexpected revenue.
Reporting:
- Structure: Create sections for Executive Summary, Revenue Analysis, Expense Analysis, Profit Margins, and Recommendations.
- Visuals: Include bar charts for revenue and expense trends, pie charts for expense distribution, and tables for financial ratios.
- Narrative: Draft text explaining the monthly performance, reasons for variances, and recommended actions.
Review and Validation:
- Internal Review: Conduct a peer review within the finance team.
- Stakeholder Feedback: Share the draft report with the CFO and department heads for feedback.
Presentation and Distribution:
- Presentation: Prepare a PowerPoint presentation highlighting key findings for the monthly management meeting.
- Distribution: Email the final report to senior management and upload it to the company’s shared drive.
Continuous Improvement:
- Feedback: Gather feedback from management on the report’s clarity and usefulness.
- Process Refinement: Implement suggested improvements for the next month’s report.
- Skill Update: Attend a webinar on advanced data visualization techniques to enhance future reports.
Conclusion
Mastering financial analysis involves more than just understanding numbers. It requires setting measurable, time-bound, attainable, relevant goals and ensuring effective reporting. By following this comprehensive framework and leveraging the appropriate tools, financial analysts can enhance their contributions to their organization’s success. Continuous learning and adaptation are vital, as the financial landscape is always evolving. Implementing these strategies will not only improve goal management and reporting but also support informed decision-making and strategic planning.


